
Snapshot of top ranked states
- Eva Mitchell
- Oct 5, 2023
- 2 min read

Updated: Jan 2, 2024
Condition of Career Readiness in the United States
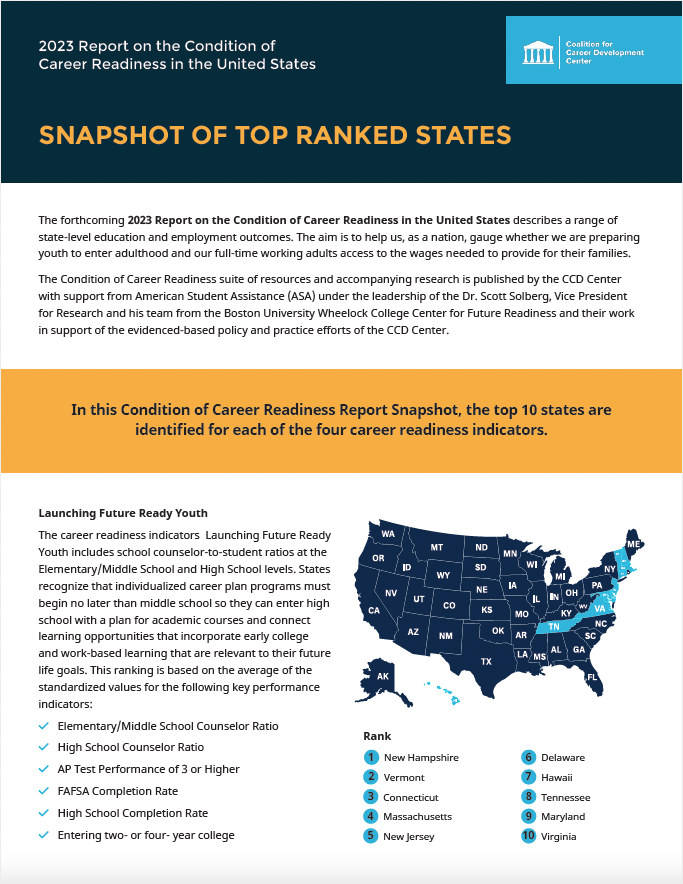
The forthcoming 2023 Report on the Condition of Career Readiness in the United States describes a range of state-level education and employment outcomes. The aim is to help us, as a nation, gauge whether we are preparing youth to enter adulthood and our full-time working adults access to the wages needed to provide for their families.
Methodology
A total of 13 indicators were used to create career readiness scores in three categories (Launching Future Ready Youth, Navigating into Adulthood, and Adult Pathways to Social Mobility), based on the different phases of career readiness (prior to post-secondary education, during post-secondary education, after post-secondary education). All data were collected from different institutes (i.e., U.S. Department of Education, IPUMS USA) and are publicly available. The data were merged, standardized, and summed to create the career readiness score. More details about each indicator, their definitions, and resources are provided in the following section.
Data, Definitions, Resources
Category | Data | Definition | Source |
|---|---|---|---|
Launching Future Ready Youth | Elementary/Middle School Counselor Ratio 2020-21 | Number of students per school counselor in grades 1 to 8 | U.S. Department of Education National Center for Education Statistics Common Core of Data (CCD) "State Nonfiscal Public Elementary/Secondary Education Survey" |
Launching Future Ready Youth | High School Counselor Ratio 2020-21 | Number of students per school counselor in grades 9 to 12 | U.S. Department of Education National Center for Education Statistics Common Core of Data (CCD) "State Nonfiscal Public Elementary/Secondary Education Survey" |
Launching Future Ready Youth | AP Test Performance of 3 or Higher (%) 2020-21 | Percentage of exam takers earning a 3 or higher (between 1 to 5) on any AP® exam among total exam takers on the AP® annual performance report. | |
Launching Future Ready Youth | FAFSA Completion Rate (%) 2021-22 | The percentage of 12th-grade exam takers who earned a score of 3 or higher (on a scale of 1 to 5) on any AP® exam among the total number of 12th-grade exam takers. | |
Launching Future Ready Youth | (Cohort based) HS Completion Rate (%) 2018-19 | The percentage of public high school freshmen who graduate with a regular diploma within 4 years of starting 9th grade. | |
Launching Future Ready Youth | (Cohort based) Post HS Placement - college (%) 2018-19 | All first-time postsecondary students who graduated from high school in the previous 12 months and were enrolled at reporting institutions. | Rates of later years were based on the three data resources: Digest of Education Statistics Table 205.80, 219.20, 309.20 |
Navigating into Adulthood: Postsecondary Outcomes | Retention rate-part time (%) 2019-20 | Percentage of college part time students who are again enrolled in the current fall among part time students who enrolled in the last fall | |
Navigating into Adulthood: Postsecondary Outcomes | Retention rate- full time (%) 2019-20 | Percentage of college full time students who are again enrolled in the current fall among full time students who enrolled in the last fall | |
Navigating into Adulthood: Postsecondary Outcomes | PS completion (2 years) (%) 2019-20 | Percentage of students who completed in 3 years from 2-year colleges | |
Navigating into Adulthood: Postsecondary Outcomes | PS completion (4 years) (%) 2019-20 | Percentage of students who completed in 6 years from 4 year colleges | |
Navigating into Adulthood 2: Young Adults Deserve a Brighter Future (19-27yrs, 2021) | Disconnected Young Adults (%) 2021 | Percentage of young adults who are not working or participating in education or training | |
Navigating into Adulthood 2: Young Adults Deserve a Brighter Future (19-27yrs, 2021) | Median Hourly Wage For Full-time Young Adults ($) 2021 | Median hourly wage among young adults who work full-time and report an annual income of equal to or greater than zero. | |
Navigating into Adulthood 2: Young Adults Deserve a Brighter Future (19-27yrs, 2021) | Full-time Young Adults Earning More than a Living Wage (%) 2021 | Percentage of young adults working full-time who earn above a living wage in their state. | |
Adult Social Mobility | Full-time working adults | Percentage of Adults (34-36) who are working full time. | |
Adult Social Mobility | Wage earnings for full-time working adults | Launching Future Ready Youth | |
Adult Social Mobility | Full-time working adults earning above a living wage | Launching Future Ready Youth |
Calculation
1. All indicators, except for 'Post HS Placement - college (%) 2018-19' and 'Full-time Young Adults Earning More than a Living Wage (%) 2021,' are reported as exported original data from the sources.
2. The 'Post HS Placement - college (%) 2018-19' indicator was calculated using the following equation.
Post HS placement - college =
(Number of college enrollment of students graduated within 12 months from public or private high school)(Number of public high school graduate)+ (Number of private high school graduate) X 100
3. The 'Full-time Young Adults Earning More than a Living Wage (%) 2021' indicator was calculated using the equation provided below.
Full-time Young Adults Earning More than a Living Wage =
(Number of full-time young adults earning more than a living wage of their state)(number of full-time young adults in the state) X 100
4. Two indicators—Counselor ratio and Disconnected young adults—were reverse coded to ensure that a higher score represents higher career readiness.
5. To synthesize scales across different indicators, all indicators were standardized resulting in a mean of 0 and a standardized deviation of 1.
6. The Career Readiness scores of Launching Future Ready Youth, Navigating into Adulthood, Adult Pathways to Social Mobility were calculated by taking the average of the standardized scores across the different indicators.
7. The states were ranked in descending order based on their Career Readiness scores. The higher-ranked states demonstrate higher levels of career readiness.
Recommended Source:
Solberg, V. S. H., Park, C. M., Donnelly, H. K (October, 2023). Condition of Career Readiness in the United States: Snapshot of Top Ranked States. Alexandria, VA: Coalition for Career Readiness Center.


Comments